Download Our 2021-2023 SOAR Bloom Spray Research Results

Don’t miss out on this opportunity to elevate your crop yields and financial returns. Discover the power of SOAR Bloom Spray today on cotton yields today. Download the in-depth research results and unleash your farm’s true potential.
Experience the groundbreaking innovation of SOAR Bloom Spray, revolutionizing agricultural micronutrients for over five decades.
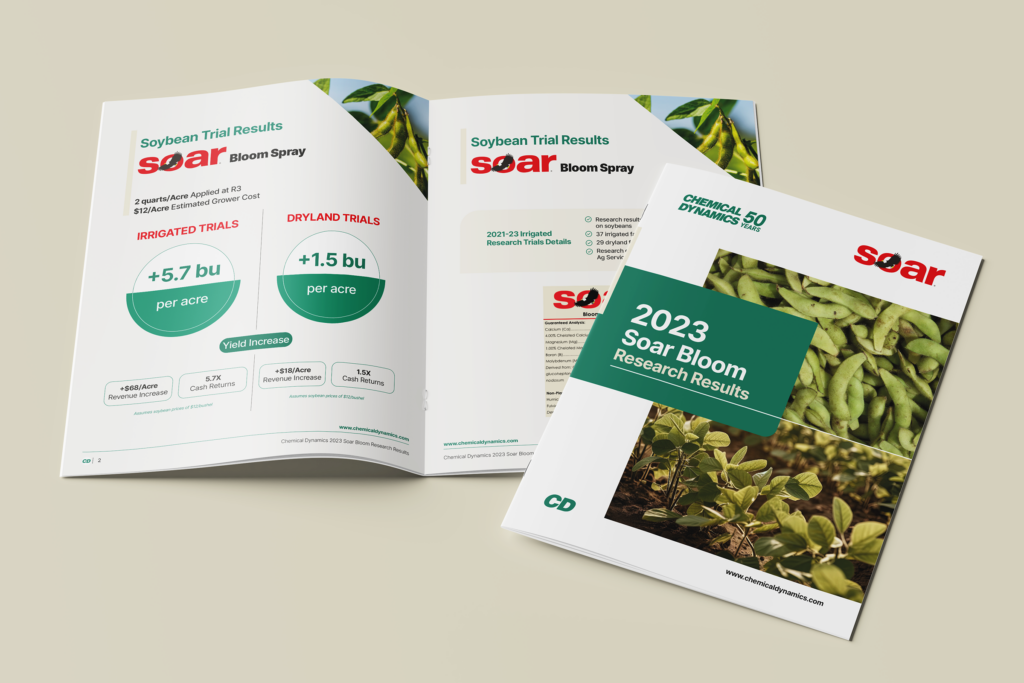
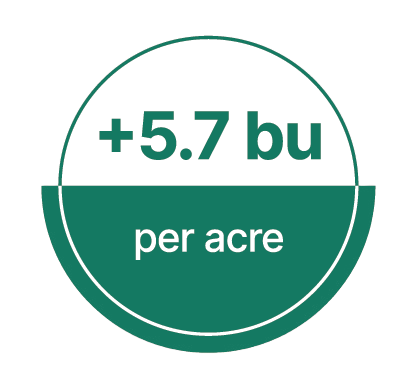
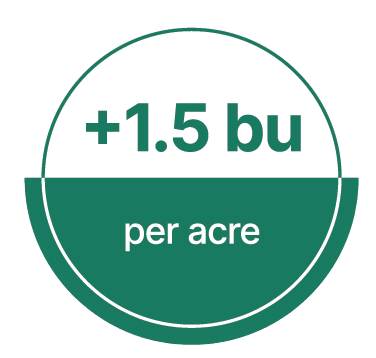
With trial results demonstrating yield increases up to 5.7 bushels per acre in irrigated conditions and 1.5 bushels per acre in dryland, SOAR Bloom Spray is the cornerstone of agricultural success.

Bloom Spray
2 quarts/acre x2
Applied at R3
$12/Acre
Estimated Grower Cost
Yield Increase
Assumes soybean prices of $12/bushel
Yield Increase
Assumes soybean prices of $12/bushel
Assumes soybean prices of $12/bushel
For 50 years, Soar Bloom Spray, our flagship product, has been changing the game in agricultural micronutrients. By harnessing the power of biologically active seaweed-based compounds, Soar Bloom Spray stimulates the production of beneficial enzymes and catalysts within plants, unleashing their true potential.
Trial Details
With proven results showing up to $68 per acre revenue increase in irrigated trials and $18 per acre in dryland, Soar Bloom Spray is your key to transforming agricultural productivity and profitability. Maximize your yield potential and investment returns by contacting the experts at Chemical Dynamics. Let us guide you through the process of integrating Soar Bloom Spray into your crop management strategy, ensuring you leverage every opportunity for growth and success.


